The Internet Society Pulse platform launched at the end of 2020 and since then it’s seen many groundbreaking developments.
We spent 2021 developing Pulse’s content, building databases, and putting frameworks into place to further enrich it. We formed relationships with 21 new data partners to significantly enhance the amount of data presented. And, by the end of the year, we launched two new focus areas—Internet Centralization and Internet Resilience—to complement the Internet Shutdowns and Enabling Technologies focus areas.
We’re now ready to provide data on and insight into the many issues affecting the health, availability, and evolution of the Internet.
Internet Shutdowns
There are thousands of disruptions to Internet access every day all over the world, but not all of them are due to deliberate shutdowns. Many outages are usually the result of technical errors, routing misconfigurations, or infrastructure failures. On the Pulse tracker, we only report shutdowns that we can confirm are deliberate disruptions by governments.
Internet outages affect people’s opportunities, livelihoods, health, education and can prevent them from taking part in countless civic activities and duties. Given that the current global pandemic has seen many government, health, and commercial services move online, reinforcing a reliable and stable Internet access is vital for everyone.
However, in 2021, we recorded 49 government-mandated Internet shutdowns on the Pulse Shutdowns tracker.
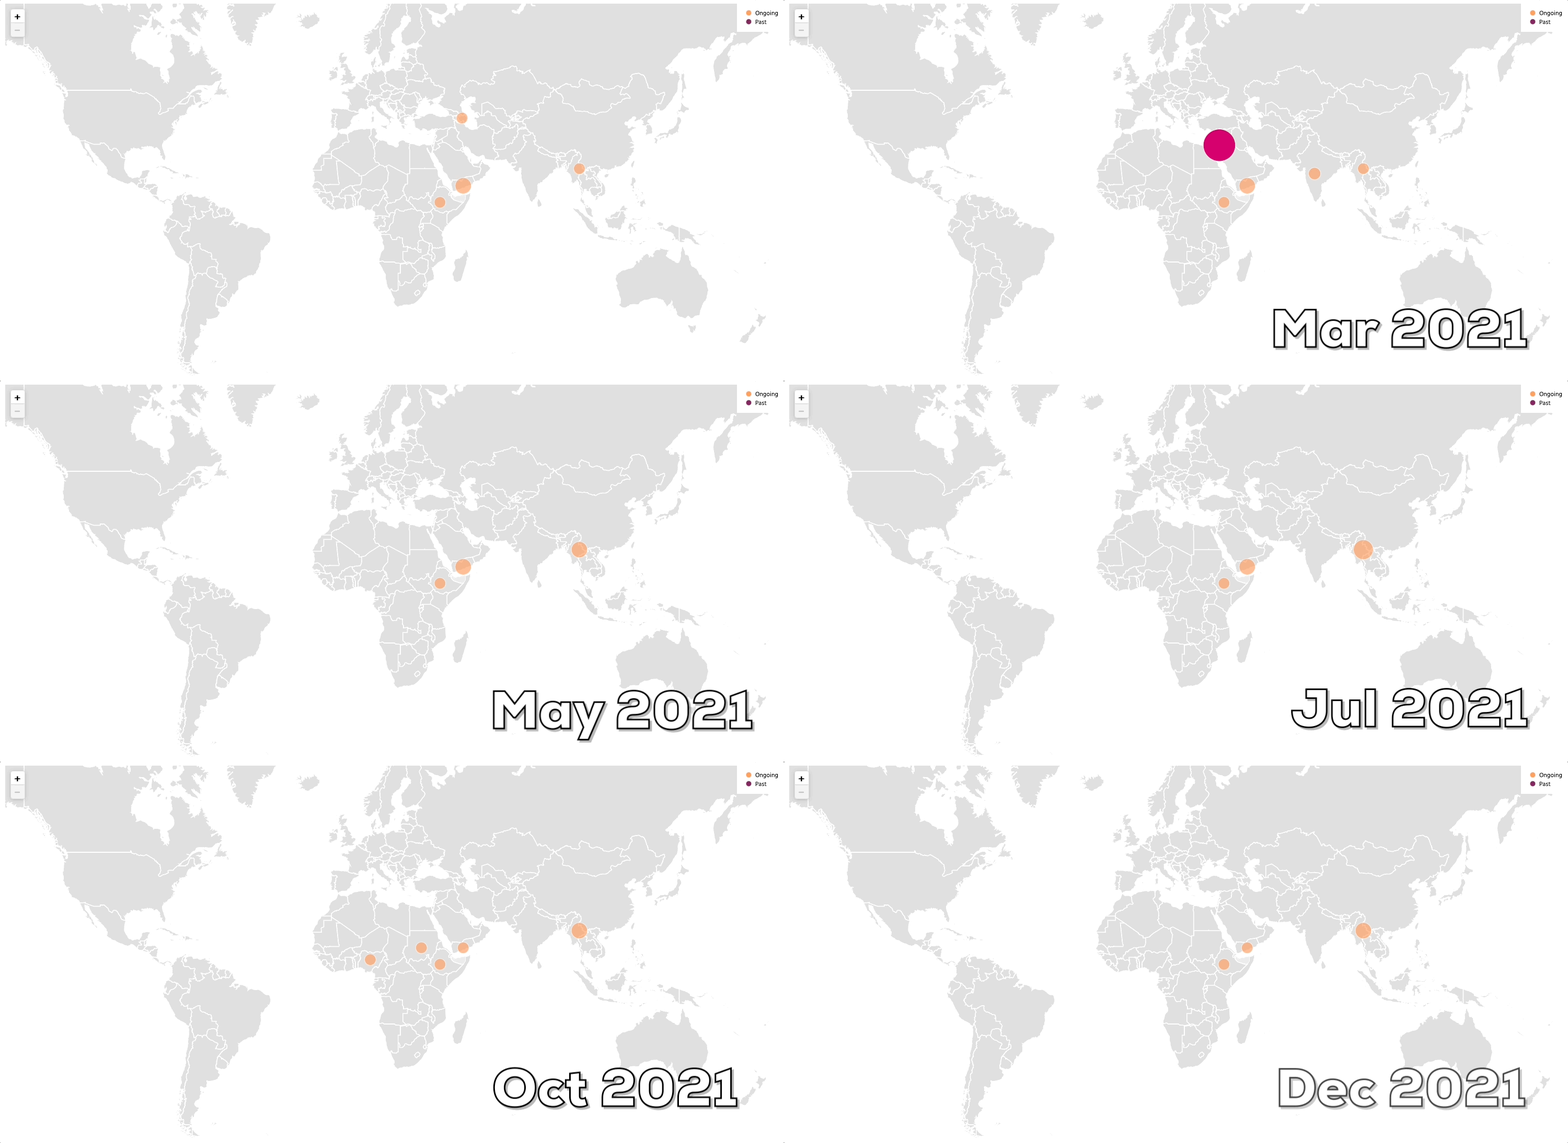
We saw shutdowns in Africa, Asia Pacific, Europe, Latin America and the Caribbean, and the Middle East. Of all the incidents recorded, 15 targeted mobile data specifically (as opposed to fixed line data) compared to just three in 2020. This is an increasing trend that reflects the increased reliance on mobile data across all sectors.
In 2021 there were:
- 17 full national shutdowns, where the entire nation’s Internet access is made unavailable.
- 26 regional disruptions, where Internet access via mobile or fixed or both is disrupted or unavailable for certain parts of a country.
- 6 service limitations, where access to specific services, such as Whatsapp, Telegram, Facebook, or Twitter are blocked.
This amounted to a total of 1,076 days of disruption. The longest disruption that ended in 2021 was in the township of Rakhine in Myanmar, which lasted for 563 days, followed by disruptions in the Amran Governate in Yemen, which ran for 267 days.
What to expect in the Pulse Shutdown Tracker in 2022: We’ll be adding new data streams and developing an automated tool to aggregate data and provide analysis more efficiently. We also want to get real world accounts of how your lives are affected by shutdowns—email us at [email protected] at to share your experience.
Internet Resilience
A resilient Internet connection is one that maintains an acceptable level of service in the face of faults and challenges to normal operation. In the new Pulse Internet Resilience focus area, we’re tracking how resilient a country’s Internet connectivity is using the Internet Society Internet Resilience Index (IRI)—the first Index of its kind.
We’ve launched this unique set of measurements for the 54 countries in Africa and will be adding other regions shortly.
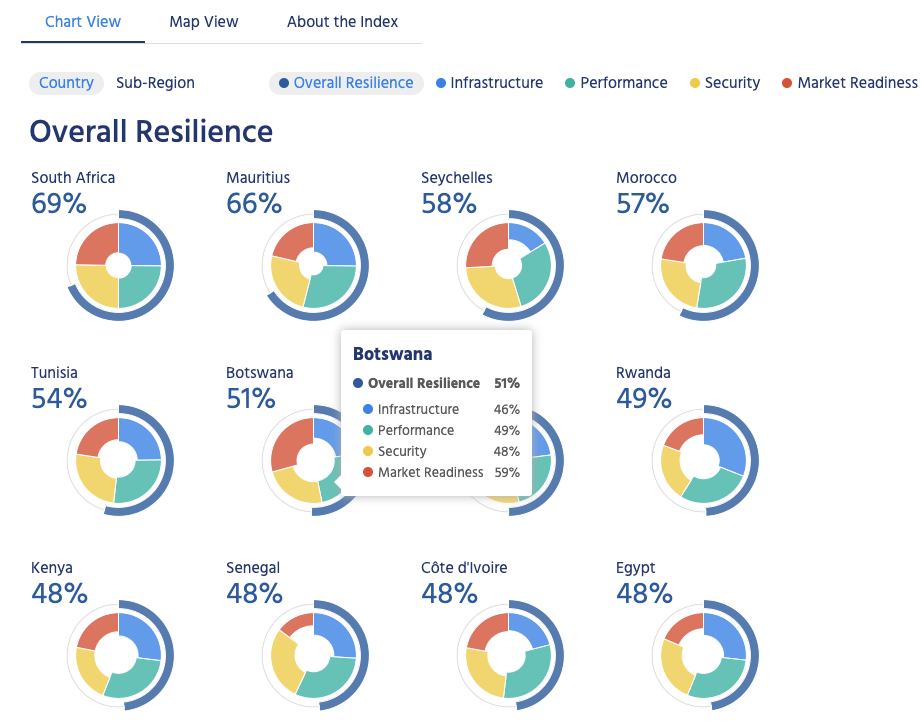
Many low-income countries often have under-provisioned networks and lack robust cable infrastructure and redundant interconnection systems. The likelihood of Internet outages occurring through infrastructure failures, misconfigurations, and natural disasters is much higher in these places.
The IRI is built on four main pillars, which together contribute to the smooth operation of the Internet:
- Infrastructure: The existence and availability of physical infrastructure that provides Internet connectivity.
- Performance: The ability of the network to provide end users with seamless and reliable access to Internet services.
- Security: The ability of the network to resist intentional or unintentional disruptions through adopting security technologies and best practices.
- Market Readiness: The ability of the market to self regulate and provide affordable prices to end users by maintaining a diverse and competitive market.
What to expect in Pulse Internet Resilience in 2022: We’ll be adding more regions, starting with the Latin America and Caribbean. We’ll also build and launch an interactive Internet Resilience Dashboard so you can manipulate the data in real time.
Enabling Technologies
Enabling technologies are essential to enable the Internet to keep growing, evolving, and meeting the changing expectations of users. They contribute to improved Internet scalability, security, trust, and availability.
Throughout the year we continued to track IPv6, HTTPS, DNSSEC, HTTP3, and TLS 1.3 global deployment rates to monitor how and where these technologies are being used on the Internet.
We also added routing security metrics, so you can now see adoption of route origin validation and route origin attestations as a percentage of IP space.
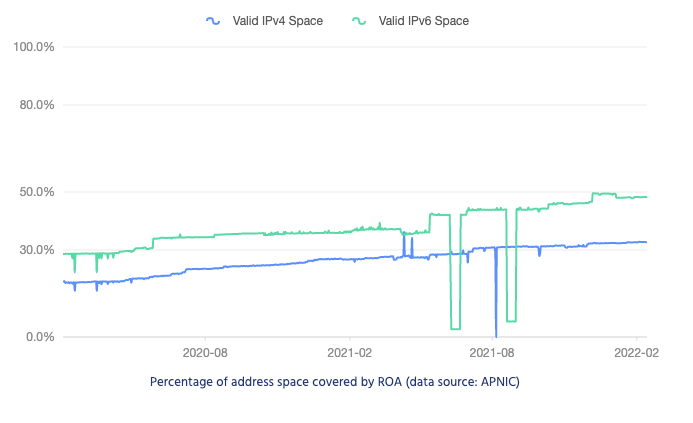
What to expect with Pulse’s enabling technologies data in 2022: We’ll be adding new data where possible, and will continue to write about key developments and trends in the deployment of the technologies we are tracking.
Internet Centralization
The Internet relies on a decentralized architecture where control of core Internet services is distributed across the “network of networks“. This ensures a more resilient network and avoids single points of failure or control.
In our new Pulse focus area on Centralization, you can see data on how the market shares of core web technologies and infrastructure is distributed. This will help us see how services are concentrated among a few actors and countries, or distributed among many, and track how this changes over time.
We present two different views of Internet Centralization:
- Market Concentration: The concentration of providers in a given market.
- Country Market Shares: The jurisdiction of providers in a given market.
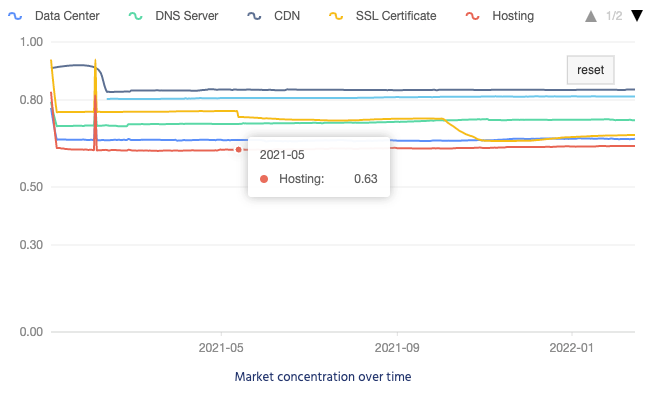
To see how market power is concentrated or distributed, and how this is changing over time, we compute two metrics—the Gini Coefficient and the Herfindahl-Hirschman Index (HHI)—based on the underlying data of market shares.
What to expect in the Centralization focus area in 2022: We’ll be adding new data and helping people understand why decentralization is good for the overall health of the Internet.
Stay Up-To-Date
Over the next year, we’ll enhance and improve upon our focus areas and our analysis of the Internet’s health, availability, and evolution. You can expect to see more commentary and narrative and more data visualizations in order to help everyone understand the data presented.
Finally, work is already underway on a fifth focus area: Keeping Traffic Local. This will quantify the extent to which local Internet traffic is being kept within a country.
